At last week’s Municipal Finance Conference in Boston, I made a brief presentation in response to a paper1 that described a new approach to deriving yield curves from municipal bond trade data. The authors have applied neural network techniques to the problem of finding underlying term structures for different segments of the municipal market.
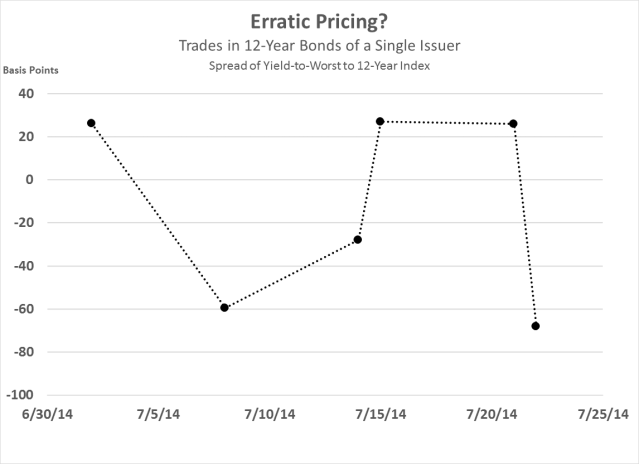
I wanted to encourage researchers into the muni market to always be mindful of its unique quirks and complexity. To make my point, I shared this chart2 with the audience:
I explained that the chart represented the average yield spreads3 for recent trades of certain bonds. The bonds have the same issuer and the same remaining maturity of approximately twelve years.
The bonds traded on only a few days last month. Notice the extreme swings in the reported average yield spreads. One day the average yield is 26 basis points (0.26%) over a relevant index, and a few days later it almost 60 basis points below the index. The average yield continued to bounce around violently for the rest of July.
I asked the audience what might explain this erratic pricing. What would you say?
1Integrating Big Data, Neuroeconomics, and Learning Networks to Model the US Municipal Bond Term Structure by Gordon Dash, Nina Kajiji and Domenic Vonella.
2The chart I presented at the conference included some details that are omitted here.
3On all days when trades occurred, these are the simple averages, for all trades, of the spread of yield-to-worst to a 12-year municipal bond index. Yield-to-worst is the lowest of the yields, corresponding to the traded price, for the various scenarios in which the bond either runs to maturity or is called on any of its call dates.
Revised August 9, 2014 with changes to penultimate paragraph.


a) Limited liquidity; b) Limited transparency, and c) Dealers happy to capitalize on a and b!
LikeLike
Kevin, thank you very much for your response, but there’s something else at work here. Best, Win
LikeLike
YTW is a flawed metric for valuing callable bonds.
LikeLike
Mike, what is your approach? Do you use some kind of option-adjusted spread? Thanks, Win
LikeLike
Yes, I would recommend incorporating OAS.
LikeLike
Thank you Mike. If you care to reply to another question, I wonder whether you include potential advance refundings in you analysis.
LikeLike
I often see this type of volatility in pricing when trade sizes vary. Larger trades made by institutions can differ significantly from smaller retail trades. Based on the information in your chart, I would guess that the average trade size on the days with higher spreads was much larger than on the days with the lower spreads.
LikeLike
Thank you Eric. Trade size is significant in the muni market, but it’s not what drives this chart.
By the way, there’s something sneaky about this problem, so I may post a hint a few days. Stay tuned.
LikeLike
Hi, I love your posts! I think they’re interesting and engaging, especially those relevant to data.
I’ve written a few blog posts on Data Analytics and Intro Machine Learning. I’d love to connect and chat about how you come up with the awesome contents 🙂
Please reach me at statsguys@gmail.com
Thanks!
LikeLike
Pingback: Puzzle #10: A Hint | The Well-Tempered Spreadsheet
Pingback: Puzzle #10: The Answer | The Well-Tempered Spreadsheet
You say they are of similar issuer and maturity, but you mentioned nothing of its credit. Are some of these bonds traded insured, giving it a higher credit and thus tighter spread vs. others which are not.
LikeLike
Thanks for your question. There is one issuer and one credit.
LikeLike
Dealers buying at more normal eval levels from institutions and selling to retail taking a big spread. You question states that these are trades, and not JJ Kenny eval levels.
LikeLike
Rich, that’s a good thought, but the spread between institutional and retail isn’t the key to this puzzle. In most cases there were both institutional and retail trades on the same day. These are represented on the chart by the average for all trades that day.
LikeLike